
Widely publicized in the Summer of 2012 was an extreme example of global warming: 97% of Greenland’s ice sheet indicated surface melting for a few days of July (Tedesco et. al 2012). This was one of the most startling shows of a vastly changing climate apart from super-storms attributed to climate change (think Hurricane Katrina in 2005). “But- isn’t there always going to be melting ice in the summer?” you may ask. Well, yes. BUT- the important thing to note is the multivariable indicators: melting, run-off, mean surface melt, refreezing, and albedo. The great melt of 2012 is an indication that the world is entering into a new stage of warming, one that is accelerating and more aggressively altering how we understand our climate.
Cue picture of sad polar bear whose eyes, calling out for help, bore deep into your soul:
So then, what does the future look like for Greenland’s ice sheet? The answer: complicated and not very good.
In the article “Greenland Surface Mass Balance as Simulated by the Community Earth System Model. Part II: Twenty-First-Century Changes” written by Miren Vizcaíno (Department of Geography, University of California, Berkeley, Berkeley, California, and Institute for Marine and Atmospheric Research, Utrecht University, Utrecht, Netherlands), William H. Lipscomb (Group T-3, Los Alamos National Laboratory, Los Alamos, New Mexico), William J. Sacks (National Center for Atmospheric Research, Boulder, Colorado), and Michiel van den Broeke (Institute for Marine and Atmospheric Research, Utrecht University, Utrecht, Netherlands), an analysis of past melting on Greenland’s ice sheet is used to create a model predicting future changes to the surface mass balance.
According to their modeling, there are some key changes to the elements that have maintained the surface mass balance (SMB) of the Greenland ice sheet that we know and love. To define this concept, SMB is defined as the net balance between accumulation (of snow/ice) and ablation (any method of snow/ice removal ex: melting, evaporation, sublimation, calving, etc.) on the surface of any glacial body. In the case of Greenland, ablation is projected to be greater than accumulation, resulting in a net loss of surface ice. Given the complexity of the article, I will break it down by explaining each component of the images below.

Albedo is the reflection coefficient that is used to determine reflecting power. Lowering albedo indicates increased melting, which according to this graphic is the future projection for Greenland’s ice sheet. "Some of
the processes driving changes in albedo are snowfall
and rainfall events, snow temperature, the occurrence of
melt, and exposure of bare ice. These changes have a
large impact on the local climate and the amount of
energy that is available for melt"(Vizaiíno 2014)

According to the article, there will be an increase in rainfall by 15-26%. Meanwhile, precipitation in the form of snow will increase slightly as well, but only onto part of the surface. This will lead to increased runoff.

While precipitation increases, refreezing increases only slightly. The ratio of refreezing to available liquid
water drops from 35% in 1980–99 to 21% in 2080–99. This means that there will not only will there be increased melting, but there will also be more precipitation contributing to run-off and melt.
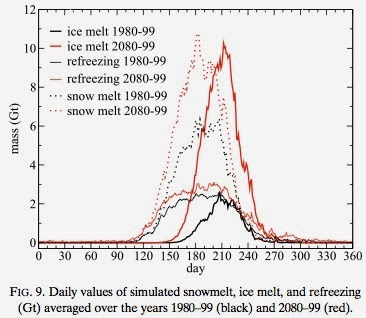
This means that "Precipitation rates increase by 18% but surface
melting and runoff increase more (215% and 266%,
respectively). The ratio of refreezing to total available
liquid water (i.e., the sum of melt and rainfall) decreases
from 35%–21%"(Vizcaiíno 2014).
According to a combination of all of the factors shown above, Vizcaíno et. al project that the number of melt days will increase by 89%, meaning that 57 days will see significant melting each year. And given the projections above, you already know how much of this liquid will not return to its solid state come Winter. This melting would contribute to a net sea level rise of over 5cm.
My suggestion? Move inland.
_ _ _
_ _ _
Tedesco, M., X. Fettweis, T. Mote, J. Wahr, P. Alexander, J. Box, and B. Wouters. 2012. Evidence and analysis of 2012 Greenland records from spaceborne observations, a regional climate model and reanalysis data. The Cryosphere Discuss., 6, 4939–4976, doi:10.5194/tcd-6-4939-2012.
Vizcaíno, M., Lipscomb, W. H., Sacks, W. J., & van den Broeke, M. (2014). Greenland Surface Mass Balance as Simulated by the Community Earth System Model. Part II: Twenty-First-Century Changes. Journal Of Climate, 27(1), 215-226. doi:10.1175/JCLI-D-12-00588.1
Bravo.
ReplyDeleteI too am concerned about this. Hopefully global climate change starts swinging the other way before its to late. I doubt it
ReplyDeleteThis is helpful...you know what would be awesome/funny? A TL;DR. ;)
ReplyDeleteComment... TL;DR
Delete