

The map above shows the number of homicides by different neighborhood locations in 2003-2012, nearly ten years of data. The city of Detroit, Michigan has never had a good reputation for safety. The crime rate in Detroit, a city that has lost half its population since 1960, outdistances that of any other large city in the United States. These data points are most likely in correlation with each other as sociologists have discussed.
Despite crime dropping in the city for three consecutive years, Detroit remains the most dangerous city in America. As is the case with most cities with high crime rates, Detroit’s poverty rate and income levels were among the worst in the country. A typical Detroit household made $25,769 in 2014, second lowest in the country and less than half of what the typical American household made. Similarly, its poverty rate of 39.3% was the second highest in the county, well more than double the national poverty rate of 15.5%.
In general, homicide rates follow the same trend as property crimes. The best available data is on homicides, so that was used a general crime marker. Homicide can be considered the worst element in crime which gives us our data for comparison with liquor stores, gas Stations, and schools where crime is most prevalent.
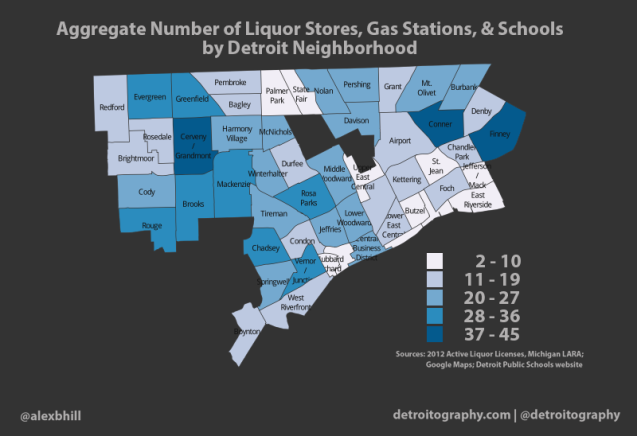
In comparing the two maps it would appear that neighborhoods that have higher density of liquor stores, gas stations, and schools also tend to have higher prevalence of homicide. All in all, many factors can impact the homicide rates in Detroit. Poverty, income rates, and location (liquor stores, gas stations, schools) can all influence the crime rate. With this data, it can be used to help police officers know where they are more heavily needed. Detroit can lower these rates by hopefully increasing minimum wage and more police.
I have acted with honesty in producing this work and am unaware of anyone who has not.
Extremely interesting correlation of the two, but would these same methods show similar results for cities worldwide and not just some of the "bad-reputation" cities? For instance, my home town is one of the safest, but we still have loads of liquor stores and gas stations.
ReplyDeleteMy first thought is that perhaps there is more crime around liquor stores, gas stations, and schools because there are larger populations in those areas – more people around would mean more stores and schools AND more opportunities for crime. I wonder if the correlation can be attributed to something more complex, though.
ReplyDeleteOne concern I have with the reliability of these maps is how the different locations are being counted. The source includes a point map of the locations of the liquor stores, gas stations, and schools and a large number of them lie along or really close to the border of between neighborhoods. Do they double count? If not, which neighborhood do they count for and why does the other not count?
ReplyDeleteIt would be very interesting to see how these methods apply to cities with a lower crime rate. Would the correlations still exist?
ReplyDeleteI appreciated your work very thanks https://www.frenchyagent.com/
ReplyDelete
ReplyDeleteIf you are looking to Buy, Sell or Rent, contact me today or visit Home for sale Detroit