
Urban developments are designed for walking with sidewalks and parks, but these are not always the safest places in the city. Geographic Information Systems (GIS) is being used to create walking maps for urban areas which often include things such as school, streets, or popular businesses. These maps include safe walking routes along with marked distances to help people become more familiar with their neighborhoods and to discover physical activity opportunities that are safe and convenient to their homes.
Making walking maps in GIS is helpful because you can create user-friendly maps that accurately represent the physical characteristics of any neighborhood, such as streets, points of interest, and natural resources. Studies have been done and it is documented that the use of maps tends to increase the physical activity among certain groups of people. Many cities and states are now creating maps to encourage their residents to be more physically active, but there is no link that these maps are being effective and increasing walking.
Walking maps were developed with substantial input from residents of housing sites, and emphasis was put on tailoring the maps to each housing site. Each map was to be designed in such a way that it would include a 0.5-mile radius around each housing unit that could be walked in approximately 30 minutes. There was also a longer, 1-mile walking route marked on the map along with the shorter route to provide a choice to the people. Maps were printed in English and Spanish and placed in high-traffic areas, as well as distributed to participants that were recruited by the program.
A study was created to test the usefulness of the maps, and participants were given a $20 gift card as an incentive to participate. Four housing sites were included in the study and the people of the different sites were racially, ethnically, and demographically diverse. After the maps were printed and distributed, the participants met in a focus group to have interviews and discuss the results. A total of 24 residents participated and their ages ranged from 20 to 65 years. 75% of participants self-identified as African American or black, 53% reported having more than a high school education (primarily some college), and 21% had less than a high school diploma.
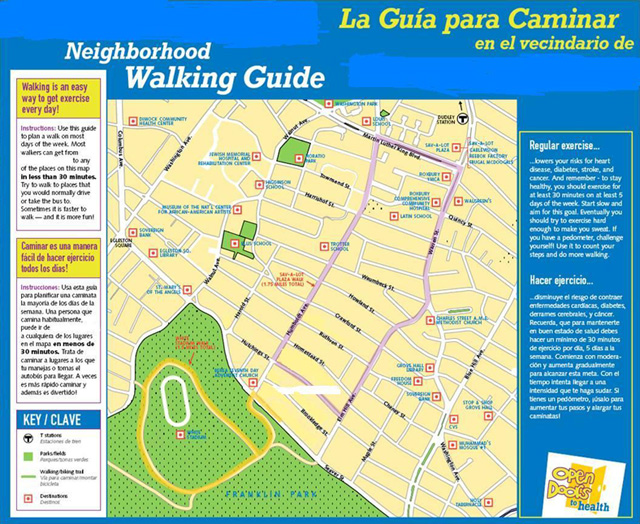 |
| Figure. Example of a neighborhood walking guide distributed in Boston, Massachusetts, 2006. |
There were five themes that emerged from the different focus groups:
1) Increased awareness of neighborhood resources – participants used the maps to learn where places were and how to get there. Although many participants already knew most of the landmarks on the maps, many used the maps to discover new places and venture to different parts of their neighborhood.
2) Walking for pleasure and utilitarian purposes – Participants talked about walking to places on and off the map including downtown, the post office, the drugstore, the supermarket, parks, the library, and community gardens. The most commonly reported use of many of the maps was for physical activity.
3) Perception of distances – A consensus among the groups was that walking outdoors helped them become more familiar with their neighborhoods in respect to changing perception of distances. Many of the residents were surprised how easy and fast it was to walk to many of the destinations on the maps. One resident stated, “I [used] to jump on the bus and go to Walgreens, and now that I know it was that close, I just walk.”
4) Community uses of the maps and fostering community – Several of the residents mentioned that the maps could be useful for new residents to the neighborhood.
5) Barriers to map use – Many of the older participants stated that the map was not easy to follow and reported being confused when trying to use the map. They suggested that one-on-one instruction would have been helpful before starting the program.
All-in-all, the walking maps helped facilitate many healthier habits among the participants and the participants encouraged that the maps be available to more people. Even though the study had a small sample size, they suggest that these maps should be tailored to each neighborhood or area, as well as have multiple destinations, but not so many that the maps are hard to interpret.
http://www.cdc.gov/pcd/issues/2012/pdf/11_0086.pdf
I think this is a great method to get people out of their homes and allows people to become more involved in the area around their home. I see GIS working great for mapping out walking trails that can allow people to explore and see the local businesses while also promoting health.
ReplyDeleteThis is really interesting that simply offering a map to a place that many who are in a lower socioeconomic levels have lived their whole lives can encourage people to go out. It is a very simple application but could make a difference in a huge number of lives, not only for the current generation but the next as they grow up. The action encourages families to spend more time together, while also mitigating a growing obesity problem.
ReplyDeleteI think it is great that GIS can be utilized for such a wide range of needs, including fairly simple and basic maps (like this one) and extremely intricate and data intensive maps. This allows GIS to provide helpful information to both the general public, as well as the scientific community. Spatial representation of data is such a valuable tool even when the data it is displaying is fairly basic. I think that people relate to and gain so much more when they are able to see an actual visual representation of an issue, ultimately making the study more effective.
ReplyDelete