
There are many more consequences resulting from Climate Change beyond ecological devastation and increasingly strong super-storms. One such consequence occurs each passing day. Little by little the Earth’s ocean levels are rising, resulting in many possible floods zone in and around coastal areas. This means that coastal communities are at high risk for future inundation. In their article “Identifying Sea Level Rise Vulnerability using GIS: Development of a Transit Inundation Modeling Method” Oswald and Treat utilize Geographic Information Systems (GIS) to make models of communities whose transit would be the most impacted by future potential flooding. Their study uses Philadelphia’s transit system (which includes both busses and trains) as a case study for their Transit Inundation Modeling Method (TIMM) considering that this large city lies on the side of the Delaware river.

“TIMM is based on a five-step process that can be applied to transit agencies to identify vulnerabilities. The process is repeatable, straightforward, GIS- based, and uses publicly available geographic data. The five steps include: (1) Define Study Area, (2) Gather Data, (3) Create Inundation Layers, (4) Analyze Data, and (5) Synthesize Results and Recommendations”(Oswald 2013, 3). According to the Intergovernmental Panel on Climate Change (IPCC)’s 2007 report, “these levels will increase between 0.18 to 0.59 meters over the next 100 years... Furthermore, current IPCC data compared to predicted values show that these predictions may be underestimated (Rahmstorf et al, 2007). Worst case scenario values include a 5.0 meter increase of world sea levels due to catastrophic collapse of the Antarctic ice sheets (Vaughan, 2006)”(Oswald 2013, 2).
The given predictions by the IPCC indicate a key vulnerability to be added into the data section of the TIMM. Taking this information into account and layering geo-referenced historic maps of Philadelphia’s transportation systems, the authors were able to create maps modeling the impact of climate change on Philadelphia’s public transportation system.

One such concern highlighted in this study was exemplified by the aftermath of Hurricane Sandy which flooded most of the Northeastern United States. In New York City, there was a massive amount of flooding specifically in the Subway system. Oswald and Treat cite that “In particular, since railways are often located in low-lying areas, they are specifically at-risk to flooding of underground tunnel and rail tracks, erosion of the rail base, and reduced clearance under bridges”(Oswald 2013, 2). As seen on the map below, this concern is relevant to Philadelphia’s extensive rail routes.

After utilizing GIS, Oswald and Treat strongly recommend that Philadelphia adapt a TIMM to best predict which areas of transit are at the highest risk for inundation and for those areas to be granted adaptation plans that would allow for necessary changes to be made to transit systems before climate induced disasters and gradual flooding.
Perhaps it’s time to start investing in city gondola lifts!
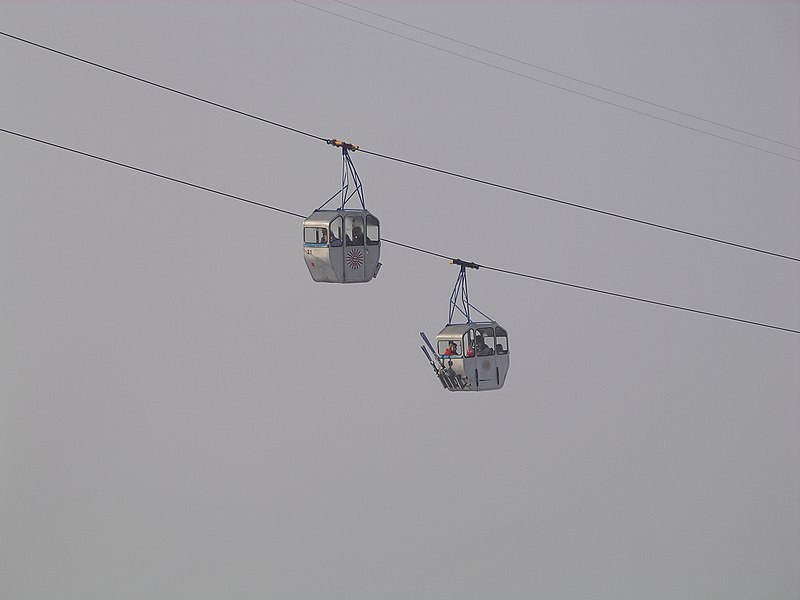
http://upload.wikimedia.org/wikipedia/commons/thumb/c/cd/Gondola_lift_lucerne_2006.03.18.jpg/800px-Gondola_lift_lucerne_2006.03.18.jpg
Oswald, M. R., & Treat, C. C. (2013). Identifying Sea Level Rise Vulnerability using GIS: Development of a Transit Inundation Modeling Method. International Journal Of Geoinformatics, 9(1), 1-10.
