Thursday, February 23, 2017

Neighborhoods and Health: A GIS Approach to Measuring Community Resource Accessibility


This journal discusses the concept of neighborhoods and health using a GIS approach to measure the resource accessibility for a community in New Zealand. Per the journal, recent studies provide a correlation between contextual traits of neighborhoods and the health of the residents that live there. Unfortunately, there has been a scarcity of studies done regarding this subject. Thus, Jamie Pearce, Karen Witten and Phil Bartie created this journal and to show the development of a new groundbreaking methodology to investigate geographical access to resources that are linked to health. In terms of GIS, it was applied to ensure a precise, relevant and understandable development of community resource measurements.

This was conducted with respect to locational aspects (shopping malls, education, recreation, health facilities) for all the 38 – 350 census mesh blocks across New Zealand. With the use of GIS, distance measurements were calculated using the weighted population center of each mesh block with relation to 16 facilities that were identified as potential health related. In other words, it measured the time between residential areas to health facilities of all types. The study proved that the basic average travel time fell between less than one minute to more than 244 minutes. Furthermore, there was considerably noticeable differences were also apparent between neighborhoods within urban areas.


This study in conclusion proved that with advances in GIS, it is now easier to directly measure access specific health related resources at the neighborhood residential level. With the high average travel times as noted and as expressed in the figures, it incentivizes for the construction of individualized community resources which will enable researchers to investigate with a more accurate notation of the impact that specific health outcomes have on neighborhoods.


J Epidemiol Community Health 2006;60:389–395. doi: 10.1136/jech.2005.043281

Tuesday, February 21, 2017

GIS & Local Food Practices

This paper combines GIS and socio-spacial analysis with different city components to view the movement of local food in Philadelphia. This study indicated only a very small portion of Philadelphia's food comes from local sources.
What local sources that do make it into the city, on average travel about 60 miles.  The authors geographically overlaid city data such as median income over the urban food system to get a better understanding of how social issues such as poverty affect the system.
Their findings indicate that farmers markets and locally sourced suppliers tend to target those with higher incomes.Those who reside in low-income areas are beginning to see an influx of locally grown foods in the form of community gardens.


https://moodle.southwestern.edu/pluginfile.php/114788/mod_folder/content/0/Kremer-2011-Philly_food_mapping.pdf?forcedownload=1

Kremer, Peleg, and Tracy L. DeLiberty. "Local food practices and growing potential: Mapping the case of Philadelphia." Applied Geography 31, no. 4 (2011): 1252-1261.

Monday, February 20, 2017

Ranching and the New Global Range: Amazônia in the 21st Century

These researchers discuss the changing land-use of the Amazon Rainforest driven by global economic factors as the primary agent for the rapid rates of deforestation in this global biodiversity hotspot. Increasing demand for cattle products among emerging economies of the developing world adopting a more Western, meat-centric diet is at the core of the rapid pastoral conversion of the rainforest. This trend initially surprised many researchers because the rainforest ecosystem was considered to have poor agricultural development potential. Contrary to this initial idea, pastoral conversion for animal agriculture avoided the challenges posed my poor soil quality for crop production.

This pattern of deforestation initially began with a five-decade rubber boom that brought extreme wealth to the region followed by a bust that left behind a largely impoverished population that was now vulnerable to global market forces. The resulting vacuum of wealth primed the conditions for a new economy centered on cattle production to emerge. The livestock industry brought millions of people to reside in close proximity to rainforest regions and required a complete and vast change in land-use from diverse forest ecosystems to biologically-barren pastors for cattle raising. Unlike the rubber industry, the Amazonian cattle industry is showing no signs (market, political, cultural, or otherwise) of sun-setting at its fifty-year mark and is having inconceivable and irreparable impacts on one of the most biodiverse regions of the planet. 

The researchers in this article attempt to use Thunian land use theory based on location rents to explain the drivers, and potential solutions, of the current crisis. According to this theory, the actions of land managers or ranchers are explained by the influences of governmental decision-makers responding to a regime of capital accumulation that targets the capture of land rents. This essentially amounts to the dominant, existing pattern of ranching encroachment into the Amazon that results from the creation of location rents or subsidies by the state in the forms of reduced transportation costs, artificial demand stimulation through trade policies, and product quality enhancements. 


GIS is applied in this study to visualize the degree of land-use change from rainforest ecosystem to pastoral-based animal-agriculture over a fifteen year period. This trend, according to the researchers, is largely spurred by governmental policy-makers who artificially alter market conditions to enhance demand for livestock goods and inadvertently accelerate deforestation rates. 


Walker, R., Browder, J., Arima, E., Simmons, C., Pereira, R., Caldas, M., ... & de Zen, S. (2009). Ranching and the new global range: Amazônia in the 21st century. Geoforum, 40(5), 732-745.

Locating farmers’ markets with an incorporation of spatio-temporal variation

This study takes place in Tucson, Arizona, and focuses on the constraints of accessibility to a farmers’ market. Consumers who prefer healthy and environmentally friendly food have certain struggles that are not experienced with general grocery stores, such as limited hours of service and practical locations.
                                        

Figure 1 displays the distribution of population based on living location and what time of day that they work. The spatial distribution of city population varies with the time of a day


Figure 3 illustrates the number of potential customers for each market within Tucson.  There is a large area within the city limits that does not have a famers’ market within 8 miles. To maximize accessibility to all people, travel distance needs to be taken into account.

Tong, D., Ren, F., & Mack, J. (2012). Locating farmers’ markets with an incorporation of spatio-temporal variation. Socio-Economic Planning Sciences,46(2), 149-156. doi:10.1016/j.seps.2011.07.002


Mapping History

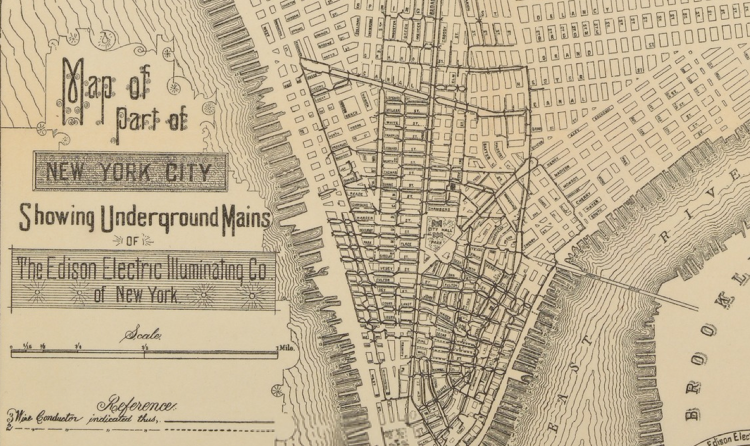
This paper, Mapping History Using Geographic Information Systems, written by Public Historian John Knoerl, discusses at length the role historical maps play in tracing change over time. That is, when using GIS, Knoerl discusses the opportunity to layer old maps over new ones in order to tangibly trace history. Primarily, this is a topic of discussion because it is a very simple way to show history to people who have no desire to actually read a historical text. Finally, Knoerl establishes the relationship between GIS and historical preservation, in the suggestion that mapping immortalizes landscape. Image result for layering old maps on new


Knoerl, J. (1991). Mapping History Using Geographic Information Systems. The Public Historian, 13(3), 97-108. doi:10.2307/3378555

PASSaGE: Pattern Analysis, Spatial Statistics and Geographic Exegesis. Version 2

Spatial analysis is an increasing growing science in the fields like landscape ecology and genetics, however, statical evidence is not easily accessible. PASSaGE 2 (Pattern Analysis, Spatial Statistics and Geographic Exegesis) is on the up and up. Surpassing its original PASSaGE, PASSaGE 2  is now more user friendly, supports both scientific analysis and classroom training, and includes a more broad array of spatial statistical analyses. But what is Spatial Analysis; its a "fundamental part of scientific inquiry including ecological, evolutionary, and environmental science, epidemiology, geology, geography and mathematics". Now, with PASSaGE 2 being a newer, easier to use, rebuilt version of the original PASSaGE there are far more downloads of it, 12,000 in over 76 countries to ball park it. With this program. there can be a stronger graphical support with a variety of mapping and graphic functions.


Rosenberg, M. S., & Anderson, C. D. (2011). PASSaGE: pattern analysis, spatial statistics and geographic exegesis. Version 2. Methods in Ecology and Evolution, 2(3), 229-232.

Soil Temperature and Insolation within Varied Topography of the Rocky Mountains

Incoming solar radiation, insolation, is a vital aspect of the processes on earth that bring forth life. Insolation directly affects temperature by adding heat to the surface of the ground, and indirecty affects on evapotranspiration, photosynthesis, wind conditions, snow melt, and air and soil temperature. Paul Rich and Pinde Fu created insolation maps from digital elevation models (DEM) and used an insolation model that accounted for; atmospheric conditions, elevation, surface orientation, and influences of surrounding topography in the Rocky Mountains. That insolation model was used to focus on soil temperature measurements within this complex topography.

The researchers found that simple interpolation in areas with varied topographical terrain did not produce sufficient data to create high resolution soil temperature maps.In order to improve soil temperature calculations Rich and Fu created an insolation-modified soil temperature model that used a geometric insolation sub model. The researchers were able to create,with accuracy, high resolution temperature maps of their study area near the Rocky Mountain Biological Laboratory in Colorado. Understanding the levels and distribution of inoslation within varied topographies could potentially be helpful in avoiding forest fires or even determining the best time to plant crops, giving this research applications in forestry and agriculture.

Fu, P., & Rich, P. M. (2002). A geometric solar radiation model with applications in agriculture and forestry. Computers and electronics in agriculture, 37(1), 25-35.

Map-making and myth-making in Broad Street: the London cholera epidemic

In the summer of 1854, there was a large outbreak of cholera in London. One section in particular, the Golden Square, and one pump in particular, the Broad Street Pump, have become a sort of legend in epidemiology (the distribution of diseases.) The recognition of these areas comes from the famous Dr. John Snow, who has often been hailed as the one who discovered the cholera outbreak was caused in large part by contaminated drinking water. Snow began investigating the rise in cholera deaths in London after hypothesizing that the public water pumps may have been the starting point for transmission of cholera. Snow went door-to-door, collecting data on the number of deaths at each household finding that a particular water supply company was responsible for more deaths than another company. He then began to investigate the water supply, finding that the water supply resulting in more deaths came from a polluted section of the Thames River, and that the Broad Street pump was used by most of the households in which deaths had occurred. 


The map above show Snow's first map, with the bars indicating the number of deaths per household. While Snow himself made edits to this map after its original publication, further studies of the cholera outbreak reveal that Snow's original hypothesis may not have been correct. It seems to be that the one who really discovered the cause and transmission of the cholera outbreak was actually Edmund Cooper, who created a map prior to Snow's, showing the households in which death occurred, and the number of deaths per household. Cooper's map was based not on the spread of cholera through the water pumps, but rather through the link between the sewage system and the cholera outbreak. 


If we think in terms of GIS, merely finding and mapping information gives the appearance of data, but it does not actually tell us the cause of an outbreak. If this is true, we can then conclude that Snow's maps were misleading in educating the public on the cholera outbreak, and that it was Cooper who discovered the true cause of the London cholera outbreak. 


Brody, H., Rip, M. R., Vinten-Johansen, P., Paneth, N., & Rachman, S. (2000). Map-making and myth-making in Broad Street: the London cholera epidemic, 1854. The Lancet, 356(9223), 64-68. doi:10.1016/s0140-6736(00)02442-9

A GIS-based spatial analysis on neighborhood effects and voter turn-out: a case study in College Station, Texas

This blog article shows the importance of using GIS data for political data that can show trends and reasoning for certain turnouts and results.

The past election has been under a lot of controversy and I feel that GIS analysts are licking their chops at the opportunity to prove Trump's voter fraud analysis true or false.

However, in this article the study was conducted on three local referenda from College Station, Texas to geo-reference voters and non-voters.


The following results were found:

" We found that the extent of neighborhood effects in local elections is heavily influenced by the voter turn-out. If voter turn-out is clustered at intermediate and large scale, voting results tend to be clustered and also exhibit a sharp polarization between high and low values. If voter turn-out tends to be uniform/regular at intermediate scales but randomly distributed at both small and large scales, there appears to be less clustering in the voting results and thus lack of the neighborhood effect. If the voter turn-out pattern is mixeduniform/regular at the small scale, random at the intermediate scale, but clustered at the large scale, the voting results show a stronger neighborhood effect."

The results are basically saying that neighborhood turn out heavily effects results and the decisions being made. The neighborhood effect is the effect of a neighborhood heavily voting and creating a wave effect from their votes. If neighborhood voting is random and not uniform at smaller and larger scales then the neighborhood effect does not apply because at a large and small scale the voting was not uniform, allowing it to be spread across other options more evenly.

I think using GIS for political data is very cool and definitely something I would be interested in reading. This article was an easy read because of the correlations they found between voter turn out and results from elections and decisions made.


Sui, D. Z., & Hugill, P. J. (2002). A GIS-based spatial analysis on neighborhood effects and voter turn-out:: a case study in College Station, Texas. Political Geography, 21(2), 159-173.

PASSaGE: Pattern Analysis, Spatial Statistics and Geographic Exegesis. Version 2

PASSaGE 2 is the second version of a spatial relation software that enhances the way to graphically show data for GIS. With software for spatial analysis lagging or becoming severley outdated, PASSaGE 2 is able to combat these struggles and help advance GIS further. The software excels in spatial analysis, printing maps like the one below to show a polygon map of Europe and the 355 cancer registration centers and there distance form each other.


The advanced interface for this software should push spatial analysis work further much faster and more efficient than before. This software allows for a more detailed and diagnosed maps that further the work done by this field.

Rosenberg, M. S., & Anderson, C. D. (2011). PASSaGE: pattern analysis, spatial statistics and geographic exegesis. Version 2. Methods in Ecology and Evolution, 2(3), 229-232.