While feral cats tend to cluster in cities, due to high resource abundance, they spread out more in places with little human resources and tend to have higher impacts on endangered wildlife, since they are more abundant in these areas. Cats also uniquely threaten endangered species of their own genus by interbreeding with them and therefore reducing the native gene pool of the original species.
To examine what affects the spatial ecology of cats in such environments, a team of researchers studied the feral cats in the Moura-Barrancos Nature 2000 site and part of a Bird Special Protection Area around the agroforestry areas surrounding the village of
Barrancos in the Southeast Portuguese-Spanish border, as detailed below.
The researchers only found visual evidence of cats (through live- and photo-trapping) on farmland. The best predictor for presence of cats at the farms were presence of people and length of roads and of nearby rivers. While density of these cat populations were predictable by presence of people and supplemental feeding.
Using data from five males and three females, the home ranges of the cats were found to be the farms they lived on and on average about three miles out, with males cats having larger ranges. Cat movements beyond the home ranges were mostly conducted my males who were traveling to other farms with cat populations, especially during mating season.
These data also showed cats preferred human settlements and flat areas within 200 meters of roads, with settlements more so preferred. In terms of daily movements, cats seemed to generally avoid areas with red foxes and often crossed roads and lower elevations, mainly due to the farms being at higher elevations.
This study, like others, shows that cats rely on human settlements not only as habitats but also as stepping stones across the landscape, with competing predators acting as deterrents to moving beyond human settlement. Studies have also found this accurate for feral dogs. Thus, planning of cities and other settlements can take these factors into consideration so as to reduce the effect of domestic animals on wildlife, endangered or otherwise.
Ferreira, J. P., Leitão, I., Santos-Reis, M., & Revilla, E. (2011). Human-related factors regulate the spatial ecology of domestic cats in sensitive areas for conservation. PLoS One, 6(10), e25970.
I have acted with honesty and integrity in producing this work and am unaware of anyone who has not.
Friday, February 19, 2016
Thursday, February 18, 2016
Map-making and myth-making in Broad Street: the London cholera epidemic, 1854
In the 1854, London had a cholera outbreak which Dr. John Snow stated was transmitted through drinking water. What Dr. Snow did then, was mark on a map the location of homes where people had died because of the disease. He noticed that a certain neighborhood was getting water from a private company, but the water was coming from the Thames River, which at the time was very polluted. As soon as the water pump was removed from that river, the epidemic diminished.
During the cholera outbreak, there were two competing water companies that had water pipes in the same streets. He wanted to compare them and find out exactly which one was the cause of the deaths. For his maps he used black bars to indicate the deaths. He went door to door, investigating where exactly the deaths had occurred to trace it back to a pump.
The following map shows us the deaths within a metropolitan neighborhood. The map includes the houses marked by dark black bars and the bars behind them indicate the amount of deaths within each house. He and another investigator, Cooper made several maps along the way depicting the neighborhoods in different ways trying to figure out the outbreak. As the investigations went on, the government began to use this map and fixed it up a bit, making the markings clearer to ultimately find the breakout of the epidemic and outbreak.
Contributions of GIS to Landscape Archaeology in the Middle East
Landscape approaches and geospatial tools are increasingly being used in Middle Eastern archeology. These approaches are particularly valuable here because of this geographic region’s “millennial-scale occupational history.” (p.230)
GIS has empowered Middle Eastern archaeologists in many different ways, “High-resolution, panchromatic, and multispectral images have made it possible to view entire regions from afar and conduct a virtual survey of ancient landscapes. On a practical level, this broad spatial perspective facilitates the identification of archaeological sites and off-site features over broad areas when ground access is not possible.” (p.255)
One of the applications GIS has had for archeologists is applying multi-spectral and elevation remote-sensing datasets to reconstruct settlement patterns in northern Mesopotamia and other nearby regions. Through an algorithm that automatically identifies these archeological features based on elevation. They verified identifications against ground survey data and multispectral and multitemporal satellite imagery. (p.257)
However, satellite-based remote-sensing datasets were not equally helpful across the region. “High-resolution imagery proved useful for archaeological site prospection in lowland alluvial landscapes such as the Tigris–Euphrates and Nile River valleys. These datasets have been less beneficial in the mountainous highland areas of Turkey” (p. 249). Thus, as we can see in Fig. 3 most of the sites where the remote-sensors were utilized are located in extended low-lands or low elevation regions. Still, the combination of this approach along with ground surviving and other documentation methods provide great tools for Middle Eastern archaeologists “managing cultural heritage and documenting archaeological site destruction across the region.” (p. 266)
Source: Hritz, C. (2014). Contributions of GIS and satellite-based remote sensing to landscape archaeology in the Middle East. Journal of Archaeological Research, 22(3), 229-276.
I have acted with honesty and integrity in producing this work and am unaware of anyone who has not. -Ilka Vega
Wednesday, February 17, 2016
Effects of sterilization on movements of feral cats on Catalina Island in California, USA
With the threats that feral cats impose on wildlife, including being opportunistic predators, competing with native predators, and often carrying zoonotic disease, population management of feral cats is immensely necessary. Trap-neuter-release (TNR) is a current popular method of management; however, due to little comprehensive documentation of the effects of TNR programs on wildlife, their success are difficult to assess.
To assess the effect of sterilization on cat movement, Darcee Guttilla and Paul Stapp tracked the movements of sterilized and intact cats on Catalina Island in California, USA. Evaluating fourteen sterilized cats, half male and half female, and thirteen intact cats, five males and eight females, Guttilla and Stapp found that home range sizes differed significantly only between males and females and not between intact and sterilized cats. Similarly, home ranges of males overlapped with the home ranges of other cats of both sexes significantly more than the homes ranges of females overlapped with each other. Females also traveled farther than males on average, but not enough data existed to determine significance, as demonstrated in (b) below.
In light of the results of this and other studies, Guttilla and Stapp suggest the TNR may do nothing to alleviate predation-related threats to wildlife. However, since diseased cats are not reintroduced into the colony after trapping, TNR does reduce some zoonotic disease threats.
Guttilla, D. A., & Stapp, P. (2010). Effects of sterilization on movements of feral cats at a wildland-urban interface. Journal of Mammalogy, 91(2), 482-489.
I have acted with honesty and integrity in producing this work and am unaware of anyone who has not.
To assess the effect of sterilization on cat movement, Darcee Guttilla and Paul Stapp tracked the movements of sterilized and intact cats on Catalina Island in California, USA. Evaluating fourteen sterilized cats, half male and half female, and thirteen intact cats, five males and eight females, Guttilla and Stapp found that home range sizes differed significantly only between males and females and not between intact and sterilized cats. Similarly, home ranges of males overlapped with the home ranges of other cats of both sexes significantly more than the homes ranges of females overlapped with each other. Females also traveled farther than males on average, but not enough data existed to determine significance, as demonstrated in (b) below.
In light of the results of this and other studies, Guttilla and Stapp suggest the TNR may do nothing to alleviate predation-related threats to wildlife. However, since diseased cats are not reintroduced into the colony after trapping, TNR does reduce some zoonotic disease threats.
Guttilla, D. A., & Stapp, P. (2010). Effects of sterilization on movements of feral cats at a wildland-urban interface. Journal of Mammalogy, 91(2), 482-489.
I have acted with honesty and integrity in producing this work and am unaware of anyone who has not.
Abundance and Home Ranges of Feral Cats in a South African Urban Conservancy
Feral cats present a significant threat to wildlife. Not only have they successfully adapted to nearly as many environments as humans, but they are generalist predators that will change preferred prey according to availability, allowing them to maintain populations even when prey becomes scarce.
In rural areas, feral cat home ranges are usually fairly large and only overlap with the home ranges of relatives. In urban areas, however, home ranges usually small and dense and often overlap with non-relatives. Being an urban conservancy, the Howard College Campus (HCC) of the University of KwaZulu-Natal in Durban, South Africa acts as a combination of a rural and an urban area. As it also hosts a cat colony that is semi-managed at ten feeding stations, Jaclyn Tennent and Colleen Downs opted to study the feral cats there.
To evaluate the abundance and ranges of the feral cats at HCC, Tennent and Downs divided the campus into four study areas, including the Msinsi Reserve (Area C), based on the local ecosystems and observed the cats along tracts in each, as shown below.
In rural areas, feral cat home ranges are usually fairly large and only overlap with the home ranges of relatives. In urban areas, however, home ranges usually small and dense and often overlap with non-relatives. Being an urban conservancy, the Howard College Campus (HCC) of the University of KwaZulu-Natal in Durban, South Africa acts as a combination of a rural and an urban area. As it also hosts a cat colony that is semi-managed at ten feeding stations, Jaclyn Tennent and Colleen Downs opted to study the feral cats there.
To evaluate the abundance and ranges of the feral cats at HCC, Tennent and Downs divided the campus into four study areas, including the Msinsi Reserve (Area C), based on the local ecosystems and observed the cats along tracts in each, as shown below.
With a average colony density estimated of 40 cats per square kilometer, Areas A, B, and D each had significantly different cat population densities, ranging from an estimated 66.9 to 2.2 cats per sq. km, while no cats were observed in the Msinsi Reserve. The home ranges were also determined for six cats, half male and half female. The core ranges were found to be small and non-overlapping and the outer ranges were found to mostly be within the developed areas of campus, as seen below.
The study shows that within environment of this colony steady food supply correlates to density and home ranges of feral cats. Along with support from other studies, the data demonstrates that steady supplemental food supply not only is an effective population management method with only ad hoc sterilization of cats but also is a means of increasing feral cat welfare, as colony cats tend to have greater longevity and reduced territoriality, which leads to a decrease in cat fights.
Tennent, J., & Downs, C. T. (2008). Abundance and home ranges of feral cats in an urban conservancy where there is supplemental feeding: a case study from South Africa. African Zoology, 43(2), 218-229.
I have acted with honesty and integrity in producing this work and am unaware of anyone who has not.
Tuesday, February 16, 2016
Crime Mapping and the Crimestat Program
Law enforcement currently has a strong crime mapping function where police analysts map out general crime patterns to predict where crimes may occur and predict specific offenders. In 1996 the National Institute of Justice developed a crime mapping unit using GIS technology. This tool was used also inside police cars as they could see exactly where to go.
Crimestat contains crime incident locations (robbery locations, motor vehicle crashes, etc) that is able to interface with GIS programs allowing law enforcement agencies and criminal justice investigators a statistical tool to which they could point out possible crimes.
The following map shows hot sports of DWI crashes. The map shows first order and second order standard deviational ellipses. The first order clusters group the car crashes, while the second order groups the first order clusters. Accidents occur in small clusters, so police know usually where these incidents tend to occur and are prepared.
Levine, N. (2006). Crime mapping and the Crimestat program. Geographical analysis, 38(1), 41-56.
Post Hurricane Katrina Flood Mapping
In “Topography-based Analysis of Hurricane Katrina Inundation of New Orleans” by Dean Gesch, he discusses how geospatial data was used directly following the natural disaster. This technology provided the collection of high accuracy elevation data that provided rough estimates, specifically of piles of debris in the greater New Orleans area. This technology was especially valuable for many geospatial data users responding to the aftermath of Katrina. The data collected following Hurricane Katrina is helpful to several agencies estimating floodwater volume in other instances as well. This continues to be useful resource following natural disasters to estimate the damage among other uses.
Gesch, D. (n.d.). Topography-based analysis of Hurricane Katrina inundation of New Orleans. Reston?: U.S. Geological Survey.
I have acted with honesty and integrity in producing this work and am unaware of anyone who has not. OMFR
Monday, February 15, 2016
Dynamic Shortest Path in Ambulance Routing Based on GIS
GIS is already a useful part of the emergency response process, identifying the location of the caller, providing EMS vehicle locations to dispatchers, and determining routes for first responders. Current routing systems use a combination of street distances, speed limit, and historical traffic pattern information to plan the quickest route. Historical traffic patterns reflect the general levels of congestion along city streets at different times of the day. Although this expected congestion is an important component of travel time, it does not account for real-time shifts in traffic conditions – especially those caused by car accidents themselves.
To improve upon this model, Panahi and Delavar advocate considering real-time traffic data when routing emergency vehicles. Their routing system creates an “initial shortest path” based on the starting location of responders, their destination, and historical traffic data. If real-time traffic data is available, the route is then modified in response to changing conditions. Throughout this process, routes can be visualized and displayed on road maps to both EMS drivers and management.
Panahi and Delavar tested their model in a small area of Tehran, Iran, and found that their model reduced emergency response travel time by an average of 20%. The use of GIS-driven dynamic routing systems could mean more efficient – and therefore more effective – emergency services.
Panahi, S., & Delavar, M. R. (2009). Dynamic Shortest Path in Ambulance Routing Based on GIS. International Journal of Geoinformatics, 5(1).
I have acted with honesty and integrity in producing this work and am unaware of anyone who has not.
Simone Yoxall
The Great Pacific Garbage Patch
Twice
the size of Texas, the Great Pacific Garbage Patch stretches hundreds of miles
across the northern portion of the Pacific Ocean and serves as one of the most
alarming examples of just how humans are violating this planet. Comparatively
speaking, the Great Pacific Garbage Patch poses as equally, if not more
destructive than ocean acidification due to the unknown devastation of sunken
debris. Also known as the Pacific Trash Vortex, the patch is comprised of a
Western Garbage Patch that originates near Japan, as well as an Eastern Garbage
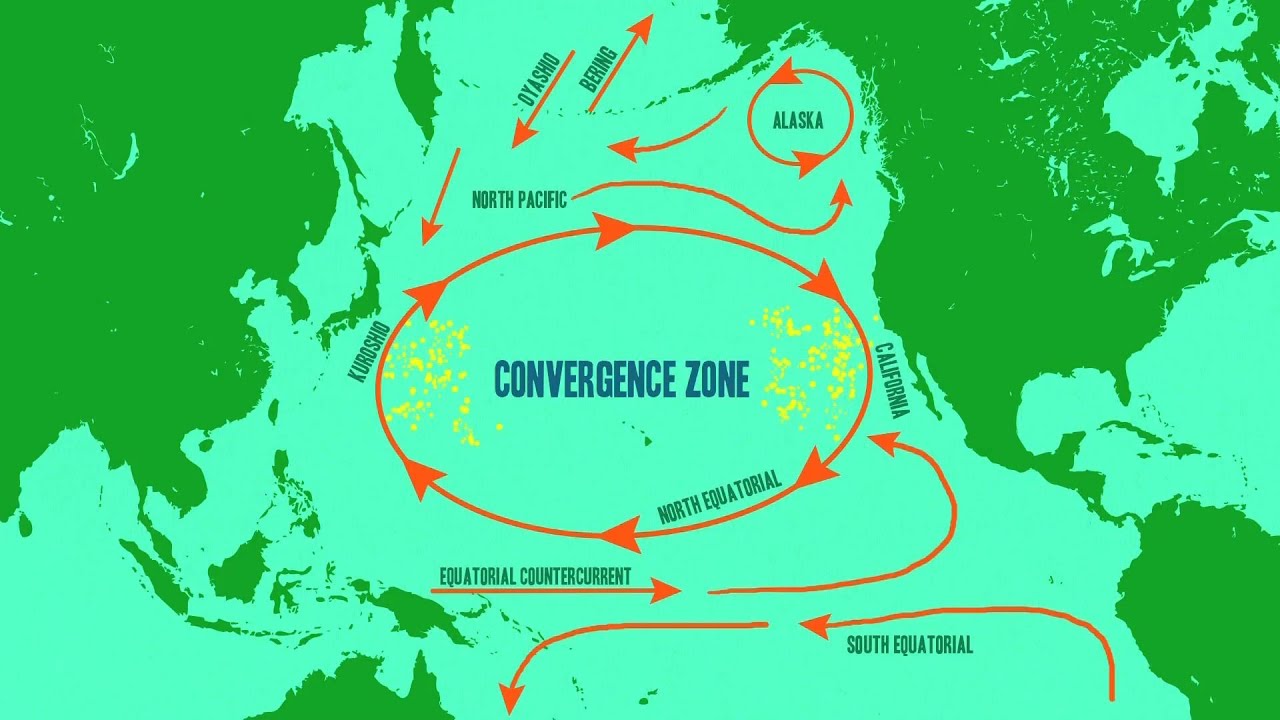
Patch located in between the United States and Hawaii. The areas of spinning debris are connected by the North Pacific
Convergence Zone which creates what would be similar to a flowing highway
passing back and forth from both patches. The entire Great Pacific Garbage
patch is linked together by the North Pacific Subtropical Gyre, which is a
system of circular ocean currents formed by the earth’s wind patterns and the
forces created by the rotation of the planet. The North Pacific Subtropical Gyre is created by the
interaction of the California, North Equatorial, Kuroshiro, and North Pacific
currents. The marine debris left at a stand still trapped between the flow of the currents has no means of escaping, leaving a negative impression on the surrounding biodiversity. Reigning havoc down to even microscopic levels, humans are often blinded by the negative externalities of plastic waste in the ocean and will often place more concern into matters such as acidification. One solution to cleaning up the multi-million dollar landfill is basically creating vacuum tubes that will run for miles to bring the plastic back to land. Mapping can be an affective tool to measure the flow of the currents carrying the patch and to decide where to place the vacuum tubes to intercept the cycling trash. Below is a map of the currents.
I have acted with honesty and integrity in producing this work and am unaware of anyone who has not.

I have acted with honesty and integrity in producing this work and am unaware of anyone who has not.

·
NRDC. Solutions to our Plastic Problem in our
Oceans. National Resources Defense Council. 8 March 2014. p. NA
Mapping Sinkholes
A sinkhole is an alarming yet fascinating feature of mother nature that many do not pay any attention to when considering locations of living. The most damage reported from sinkholes usually occur in the Southeast region of the United States including states such as Texas, Florida, and Alabama. Ranging anywhere from one foot to more than a hundred feet deep, a sinkhole is an area of ground that has no external natural surface drainage. Typically sinkholes go unnoticed while in formation and that is what causes them to be so dangerous. Water beneath the land surface erodes the rock that structures that land eventually leading to a collapse that can be miniscule or devastating and quite expensive to repair. Sinkholes are common where the rock below the land surface is limestone, carbonate rock, salt beds, or rocks that can naturally be dissolved by groundwater circulating through them. Using mapping, geologists have been able to label the locations in which the rock beneath the land surface are most prevalent for erosion. These locations should be considered by those who are looking to settle into houses above these kinds of ground rock. Although the odds are slim of collapsing in a sinkhole, the outcome would be devastating.
I have acted with honesty and integrity in producing this work and am unaware of anyone who has not.
Scott, T. Sinkholes.The USGS Water Science School. p. NA. 2 December 2015.
I have acted with honesty and integrity in producing this work and am unaware of anyone who has not.
Scott, T. Sinkholes.The USGS Water Science School. p. NA. 2 December 2015.
Subscribe to:
Posts (Atom)