Sunday, January 26, 2014

The Effect of Community Gardens on Neighboring Property Values

For a metropolis the size of New York City, space can certainly be a point of contention. However, how can one compare a space that hosts a high-rise apartment complex that rakes in tax dollars for the city with a small park that offers zero commerce? Or, what about a community garden? When an engaged citizen approaches their municipality and speaks of numerous benefits for the community that accompany the instillation of community gardens (fresh produce in the neighborhood, recreational offerings, community building, etc.), there is now data which may support their cause in terms of the effect of community gardens on surrounding property values.

This study, conducted by Ioan Voicu and Vicki  Been in 2008, seems to provide evidence that the presence of community gardens significantly impacts property values in the immediate vicinity over time for the better. The authors point out that there isn't really an unbiased manner of assessing the utility of a space dedicated for a community garden or if there’s an adequate amount of time before the space can be appropriated for another purpose. Their study focused on gardens located in New York City and the property values of lots within and outside of 1,000ft from a specific garden. This ring permits the researchers to compare the difference in prices for properties in and outside the space before and after the garden was opened.

Of course, it’s not quite that simple. Gardens are likely to be installed in places that have cheap property values to begin with, so there’s no guarantee that those properties weren't already increasing with value regardless of the presence of a new garden. But, one can use statistical models which eliminate much of this bias.

The results from the study clearly indicate that property values within the 1,000ft ring increased in value over five years at a wider margin than those properties in the surrounding neighborhood. The study also determined that this effect was more profound in disadvantaged neighborhoods and that the quality (determined by various criteria including accessibility to the general public, fencing attractiveness and permanence, cleanliness, landscaping quality, presence of decorations, existence of social spaces and overall condition of the garden) of the garden affected the margin of difference in property values.


It’s important to note that this is a correlation and not a causality because who’s to say that it is the garden itself and not the type of neighborhood that includes engaged citizens that might install a garden that is accounting for these differences. Nonetheless, this study is great news for the community garden movement. In a city landscape where economics are often divisive for decision-making, it is hard to argue with the clear benefits derived by the areas surrounding these hubs of vegetable productivity. 

Voicu, I., & Been, V. (2008). The Effect of Community Gardens on Neighboring Property Values. Real Estate Economics, 36(2), 241-283. doi:10.1111/j.1540-6229.2008.00213.x

Road Construction, Deforestation, and Land Use in Belize

Chomitz, K. M., & Gray, D. A. (1996). Roads, land use, and deforestation: a spatial model applied to Belize. The World Bank Economic Review, 10(3), 487-512. https://lms.southwestern.edu/file.php/5760/Literature/Chomitz-1996-Belize_deforestation.pdf

This article examines the relationship between distance from markets in Belize, road construction, and the likelihood of road construction and land use. The authors contend that while road construction has many economic and social benefits of connecting the rural poor to more urban centers, there are also great environmental drawbacks. This is largely seen through deforestation, loss of biodiversity, and climate change. According to Chomitz and Gray, Belize is facing rapid population growth. With this, there is an increase in slash and burn agriculture. As a result, the authors assert that the impact of building roads in these rural areas must be quantified in order to see the full tradeoff between economic development and environmental preservation (Chomitz and Gray 487)


In order to conduct this study, the authors used “spatially explicit framework” in order to show variation that is not present in aggregate data and location, such as the physical extent of deforestation and the effect on habitats and watersheds (Chomitz and Gray 488).  The authors developed a spatial model of land use following the ideas of von Thünen that assumed land use would occur where the output was greater then input  (490). A sample of land points south of the Western Highway in Belize was used, which yielded 11, 712 data points for the study. These points were collected via geographic information systems methods. SPOT satellite imagery from 1989 to 1992 was used to collect the data along with field data. Nine variables where used to analysis the data (nitrogen percentage, slope, available phosphorus, pH, wetness, flood hazard, rainfall, national land, and forest reserves). Additionally, the distance to the markets was computed by the cost of transport and the slope of the region. The land use was classified into three categories- semi-subsistence agriculture, commercial agriculture, and natural vegetation- to help analyze the results and create a dependent variable of type of land use (Chomitz and Gray 495).  

The study suggests that land quality, market distance, and tenure, strongly suggest type of cultivation, likelihood, as well as probability of road construction (Chomitz and Gray 501). For example, the study found that for every 0.1 percent increase in nitrogen, there was 24-33 percent decrease in distance to a market, suggesting that higher soil quality increases the likelihood of cultivation and thus road construction (Chomitz and Gray 500). This model also allowed the authors to study the type of agriculture that occurs in variation to distance from markets and road availability. For example, the study found that semi-subsistence and commercial agriculture decrease as one progresses away from markets (Chomitz and Gray 500). Due to these findings, the authors’ advocate for greater consideration to be taken by planners in terms of agriculture and road construction due the variety of variables involved as well as environmental and economic trade off. 


Caitlin Schneider
Alec Bergerson
Edited (February 16)

Loose-coupling an air dispersion model and a geographic information system (GIS) for studying air pollution and asthma in the Bronx, New York City
                
Air pollution has known effects on human health, especially in densely populated cities where air pollution is a common problem.  Scientists at Lehman College, City University of New York developed a procedure to loosely integrate the air dispersion model, AERMOD, into the geographic information system ArcGIS in an effort to more accurately correlate air pollution and instances of asthma hospitalization in the Bronx.  They developed a quick and efficient way to incorporate these complicated programs by using output data from ArcGIS as input data for AERMOD and then further analyzing the data collected from AERMOD back in the ArcGIS software.
         

Using this method and incorporating various maps, information on 33 stationary point sources of pollution and hospital information regarding asthma hospitalizations, the researchers were able to find correlations between asthma and pollution.


The emissions data and locations were extracted from the National Emissions Inventory (through the EPA), the data on asthma hospitalizations was collected from the New York State Department of Health, and the populations information was extracted from the US Census. Using all of this data and analyzing it using ArcGIS and the AERMOD dispersion model, correlations were determined between stationary point sources of pollution and asthma. It was found that in the areas closer and more affected by the point sources, asthma hospitalizations were higher than in the areas further away from these sources of pollution.


Research like this is important for determining how high pollution areas can cause detrimental health problems on local residents and can be used when observing socioeconomic inequalities in high density areas.  Additionally, this method of integrating dispersion modeling into GIS could be used for other things, including impact assessment, transportation projects and  more.

References
Maantay, J. A.,  Tu, J., and Maroko, A. R. (2009). Loose-coupling an air dispersion model and a geographic information system (GIS) for studying air pollution and asthma in the Bronx, New York City. International Journal of Environmental Health Research. 19(1), 59-79. From ebscohost.com.

Political Migration

People have known for a while that more densely populated areas, like cities and towns, tend to have a larger proportion of the population as democrats than republicans. People have also known for a while that more rural areas tend to have a larger percentage of republicans than democrats.
Previous examinations and now more current studies have gone into great detail examining to partisanship plays such a role in migration patterns from city to rural or rural to city. Republicans tend to be moving out of cities to the countryside and democrats tend to be moving from rural areas to the urban areas. Many of the republican voters moving from city to the countryside are elderly. One reason for elderly to make this move is people who are retiring tend to elderly want live in the quite countryside. The elderly also tend to have more money than younger Democrats so they can afford to move farther away than some young democrat just staring out in his career. Some of the younger republicans also want to be with people who share some of their values and or identify as the same race. There tend to be more whites in the country side than any other race in many parts of the United States. One of the values Republicans have that cannot be fully enjoyed in the cities is the use of fire arms. Cities tend to have stronger anti-gun laws than in the country side. This is one reason Republicans are moving out of the city and moving farther than democrats in the process.
Democrats tend to not move as far as Republicans, when they do move, but there is still a preference for Democrats to be with people who share similar values.


 These younger crowds of Democrats are likely to be students and want to move to a college close to home for a quality education. Many top schools are close to, if not in, city limits. Young Democrats also tend to like the atmosphere in cities in some ways better than in the country side. There are more advanced technologies and more available gadgets in the cities as well as more food and drink choices that appeal to young democrats that they cant get as often in the country side,  like Star Bucks

References


Tam Cho, W. K., Gimpel, J. G., & Hui, I. S. (2013). Voter Migration and the Geographic Sorting of the American Electorate. Annals of the Association of American Geographers, 103(4), 856-870.

Wednesday, January 15, 2014

Partisanship Migration


Cho, Wendy and J. Gimpel, I. Hui (2013). Voter Migration and the Geographic Sorting of the American Electorate, Annals of the Association of American Geographers. 103 (4), 856-870. http://myweb.uiowa.edu/bhlai/workshop/gimpel.pdf

This article examines migration patterns within the United States of America through the lens of partisanship.
The authors claim that the geographic pattern of partisanship is spatially non-random. While people may not migrate with partisanship in mind, there are factors that correlate to partisanship. Employment opportunities, race, income levels, education and housing are main determinants in migrating, and do correlate to party association.

This study was conducted over a period of fours in seven different states: New Jersey, Maryland, Delaware, Pennsylvania, California, Oregon and Nevada. Voter registration files from 2004, 2006 and 2008 were collected and referenced to gather the data. These states were chosen because they represent two groups of adjacent states, register voters by party and have high-quality, accessible voter registration files.

The study found that more than half of people moved within their county. Democrats moved more frequently than Republicans, but they also comprised a larger share of the registered voters. The authors confirmed a theory that Democrats congregate in more urban areas, while more Republicans moved to suburbs or rural areas. The map below confirms this trend in Portland, Oregon.

Republican migration out of Portland

Democratic migration to Portland 

Map-making and myth-making in Broad Street: the London cholera epidemic, 1854

Brody, H., Rip, M. R., Vinten-Johansen, P., Paneth, N., & Rachman, S. (2000). Map-making and myth-making in Broad Street: the London cholera epidemic, 1854. Lancet (London, England), 356(9223), 64–68. 

(http://www.ph.ucla.edu/epi/snow/mapmyth/mapmyth_fig1.html)

Image from eagereyes.org


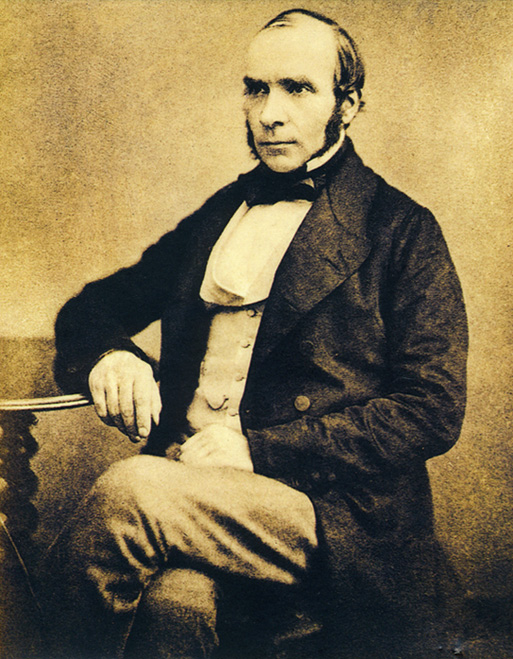
In a few select circles, John Snow is a well-known name.

Image from fanpop.com

Image from Historyday.coldray.com
No, not that one.  This John Snow (right-most image).  The man who is often referred to as one of the fathers of modern epidemiology.  The work he did mapping and charting the outbreak of cholera in London during the summer of 1854 is commonly studied as the beginning of the use of geographical tools and mapmaking as a method of understanding public health concerns.  Having previously observed the effects of cholera, John Snow had developed a hypothesis as to the method in which cholera was spread through large geographic areas.  When a cholera outbreak caused more than 500 deaths in a 10-day period within a few blocks of Broad Street, an area named Golden Square in London, Snow saw it as an ideal opportunity to test his hypothesis that cholera was spread through contaminated water sources.

Dr. Snow proceeded to tabulate all of the individuals who had died of cholera within the 10-day period and marked them on a "spot map" according to where they resided.  The geographical representation of the deaths by proximity to the Broad Street water pump proved that there was in fact a major correlation between an individual's consumption of the pump's water and their illness and consequent death.  Snow, while publishing his findings, however, made clear that the spot map did not lead to his hypothesis, but rather that the map was simply a logical method of visually presenting data.
Snow's map of cholera deaths in the Broad Street area, Dec 1854
Image from Brody H et al. The Lancet 356(9223), 64-68, 2000.

Earlier that same year, another man by the name of Edmund Cooper had produced a spot map representing the same cholera outbreak.  In response to rumors floating around that "gully holes", or storm drains in American vocabulary, and sewers were to blame for the cholera outbreak, Cooper had been commissioned by the Metropolitan Commission of Sewers to draw a spot map disproving the association between cholera fatalities and proximity to storm drains.
Edmund Cooper's map for the Metropolitan Commission of Sewers, Sept 1854
Image from Brody H et al. The Lancet 356(9223), 64-68, 2000.

Along with John Snow and Edmund Cooper, the Committee of Scientific Inquiries of the General Board of Health also produced a spot map of the outbreak.  This map was equally detailed as Cooper's, but the board was hesitant to accept Snow's theory and instead was inclined to believe that cholera was spread atmospherically.  They drew a circle around the entire affected area instead of the area within walking distance of the pump, as in the map Snow had produced.
Board of Health ("government") map, from General Board of Health, 1854
Image from Brody H et al. The Lancet 356(9223), 64-68, 2000. 

Ultimately, John Snow was just as convinced of his hypothesis on the spread of cholera and disease as both Edmund Cooper and the Board of Health were of theirs.  However, Snow was unique in his method of using his spot map as a way of backing up an already well-researched hypothesis instead of using it to entirely inform his hypothesis.  While using GIS technology, we must consider that the risk of stumbling upon associative data is a real one.  We must use scientific methodology in conjunction with geographical representation.  "Associative data, plotted in the form of a highly sophisticated and accurate map, may easily seduce us into concluding that we have learned something", be it true or not (Brody).  If this were not the case, we would be publishing Edmund Cooper's methodology and maps into textbooks instead of Snow's.