Monday, February 11, 2013

Urban expansion and temperature increase

Population changes and available space have always been an issue in every country, and as the human population grows, living space becomes harder to find. To solve this problem cities have expanded ever outward, and China is a prime example of this effect. China has seen a lot of growth in the past several years that has inevitably increased urban sprawl. Researcher Weng investigated the application of the integration of remote sensing and GIS for detecting urban expansion and assessing its impact on surface temperature in the Zhujiang Delta region of southern China.


This region of China also includes Hong Kong, and so has seen much urban expansion in the late twentieth century. Weng showed that the spatial pattern of radiant temperature increase correlated well with the pattern of urban development. The total increase of radiant surface temperature in the urbanized areas was 13.01°C. Weng also found that the urban expansion was uneven and that the effect of a major road on the location of urban growth and development was fairly substantial; with 66% of urban expansion happening within 2000m of a major road.


The environmental impacts of urban sprawl are felt everywhere and Weng's study can provide valuable insight on using GIS and remote sensing on the effects of urban sprawl on habitat encroachment. A problem with this study did arise however: the effects of surface roughness on radiant surface temperature were not taken into account. Accurate land surface temperature can be found only after its relationship to the component temperatures has been mathematically modeled and taken into account.

Weng, Q. Q. (2001). A remote sensing–GIS evaluation of urban expansion and its impact on surface temperature in the Zhujiang Delta, China. International Journal Of Remote Sensing, 22(10), 1999-2014. doi:10.1080/01431160152043676

Local Food, Growing Cities: Philadelphia


Local Food, Growing Cities: Philadelphia


     The rapid growth of the economy over the last century has changed the structure of the food system. Processing and distribution centers have replaced local food networks, making eating locally a challenge for people living in urban areas. Environmental problems such as deforestation, ground and water pollution, biodiversity loss, and depleted croplands can all be attributed to this shift in food production. Social problems such as diseases related to diet have also become more prominent in developed countries. Returning to localized food systems is believed to be a solution.


     Local can have varying definitions. A 100 mile radius around a point (the “100 mile diet”) is a common measure; the USDA uses a 400 mile radius, and many states simply use their own boundaries. The Sustainable Agriculture Research and Education Program at the University of California defines a local food system as “a collaborative effort to build more locally based, self-reliant food economies - one in which sustainable food production, processing, distribution and consumption is integrated to enhance the economic, environmental, and social health of a particular place.”

     The distribution of food in Philadelphia is not quite regular, as it is neither continuous nor round. 84% of the food comes from within Pennsylvania, while 42% of the farms are from only two counties. On average, food in PA travels 61 miles. To combat this high mileage, the local food movement mainly targets middle and high-income areas; urban and community gardening projects are filling in the gaps for low-income areas. GIS was used to determine which places (results show approximately 7600 acres) in the inner city would be suitable for gardens. These results suggest that, using conservative figures, over 9.9 million pounds of food could be grown truly locally for PA in a year.


Kremer, Peleg, and Tracey DeLiberty. "Local Food Practices and Growing Potential: Mapping the Case of Philadelphia." Aplied Geography 31 (2011): 1252-261. Web.

Sunday, February 10, 2013

Socioeconomic Status and Prevalence of Obesity in a Mexican American Community

Brownsville, Texas is the southernmost county in the state, Cameron County, which is directly located at the US/Mexico border, the red section below, and is highly influenced by both Mexican and American cultures. 

This Southern county was the focus of a recent study, intending to analyze the prevalence of obesity and other health issues in a specifically Mexican-American community. Between 2004 and  2007, researchers extensively studied 810 people between the ages of 35 and 64 years, recording their weight and height (thus calculating their BMI), as well as running blood tests to determine glucose levels. Researchers then organized their results in accordance to their income levels, to determine whether there was a correlation between obesity levels and lower incomes. 


The map above illustrates the distribution in location and the density of the participants in the first and third quartile. The first quartile refers to those with incomes lower than $17,830, and the third between $24,067 and $31,747. These divisions were chosen as socioeconomic markers, to divide up the data and show clearly how income levels affect health.

This research project was incredibly eye-opening in the lack of access to adequate health care, as a majority of participants did not have any sort of medical insurance and were too young to qualify for Medicare. Further, “nearly 1 in 10 of all participants in the lower SES stratum were informed through this study that they have diabetes,” which could lead to catastrophic and even deadly complications down the road if this serious disease had not been discovered (p.4). Although there was only a small change in obesity levels between the first and fourth quartiles, there was a significant increase in the number of cases in diabetes in the first compared to the fourth. Therefore, GIS technology is particularly useful  in this type of research as it clearly illustrates the prevalence of health issues in urban areas, as there are "high rates of diabetes, particularly undiagnosed diabetes, in the poorest of our poor who have little or no access to health care through insurance," which is often not a subject discussed, but clearly is a major problem in today's society (p.5). 


Fisher-Hoch SP, Rentfro AR, Salinas JJ, Pérez A, Brown HS, Reininger BM, et al. (2010). Socioeconomic status and prevalence of obesity and diabetes in a Mexican American community, Cameron County, Texas, 2004-2007. Preventing Chronic Disease 7(3). Retrieved from https://lms.southwestern.edu/file.php/4373/Literature/Wilson-2010-OBESITY_MEXICAN_AMERICANS.pdf

With Reserves: Colonial Geographies and First Nations Health


In Canada's province British Columbia, there are major health disparities between non-Indigenous and Indigenous peoples.  First Nation people across Canada statistically experience higher rates of "morbidity, chronic illness, acute trauma from accidents and violence, suicide, addiction, mental health issues, unwanted teenage pregnancy, and exposure to high-risk environments". 


The research team focused on health issues occurring in reserves in central British Columbia.  Through conducting qualitative research analysis they found three "themes" that were brought up by most participants interviewed for the study.  These themes were cited as reasons that access to decent health care was difficult for the Indigenous people, physically or mentally, across all ages.  These themes were as follows:
  • Spatially distant from health care resources (ie; hospitals, doctor's offices, etc.)
  • Social distancing due to racism or legal boundaries of reserves
  • "Uncommon ground"; the distance due to language barriers or uneasiness in a foreign environment
As many of the reserves are in rural areas, it is understandable that spacial distances from urban centers with higher rates of health care providers and resources would be a cause of poorer health care.  What's more, many of those interviewed must travel on "dangerous roads" or feel uncomfortable traveling by hitchhiking, which was cited as often the easiest way to get there.  The traveling to health care providers comes with financial repercussions as well.  One woman said she could lose out on over a hundred dollars every day of traveling.  What's more, for those with serious physical ailments, traveling long distances or for a day or so at a time, can prove to be physically debilitating or impossible.

Socially many of those interviewed felt isolated from areas where they could find adequate health care. Many interviewees noted on the overt racism of some health care providers, mentioning their direct accusal from a doctor or nurse that they were alcoholics or drug abusers.  

In some cases, there was an inability to translate, through language or cultural barriers, what a health care provider was attempting to say.  The incorporation of individuals who speak in Native tongues, or the additions of some aspects of "Native medicine" into hospitals and health care resources could prove to be a major help in increasing the health of First Nation people.

As of right now, First Nation men have the lowest life expectancy of the region.  First Nation women have significantly lower life expectancy that their non-Indigenous counterparts.  It appears that some very simple change could significantly alter their access to health care options and could prove to increase health across the board.


Sarah de Leeuw , Sean Maurice , Travis Holyk , Margo Greenwood & Warner Adam (2012): With Reserves:
Colonial Geographies and First Nations Health, Annals of the Association of American Geographers, 102:5, 904-911

http://www.tandfonline.com/doi/abs/10.1080/00045608.2012.674897


Thursday, February 7, 2013

Predictive Vegetation Modeling- Mojave Desert

Geographic information science has advanced passed the point of mere field survey and photointerpretation.  Now, there is predictive vegetation modeling where the researchers are able to predict the distribution of vegetation across a landscape based on the relationship between the spatial distribution of vegetation and certain environmental variables (Franklin, 1995; Guisan and Zimmermann, 2000).  These relationships can be predicted and we can find correlations based on observation and physiological limitations of certain plant species.  In order to better understand this new way to study vegetation patterns, we must consider Tobler's Law.  Things in close proximity are closer in relation than those further away.  Vegetation that grows near to each other will be more closely related and therefore more easily.  This is different from older schools of thought where each observation was individually significant and not to the group.  Now, we examine everything in relation to each other and take everything into account including the plants' abilities to grow in certain environments.

The study area in this article is the Mojave Desert, the smallest desert in the United States.  Due to the lack of precipitation, there is a high concentration of alkaline soil even with the diversity of soils containing high or low amounts of organic material. 


The acronym, CORA, represents a shrubland alliance; it is the most widely spread in the area on rocky soils, upper bajadas, pediments, and hill slopes.  This alliance is what the researchers focused on the most.

In order to make the most accurate predictions, the sample size must be large enough to account for a lot of variability.  This is especially true in cases where it is difficult to control external forces affecting the subject.  Relying too much on a small sample can lead to extrapolation.  Generalizing too much can often be inaccurate and unhelpful as to a solution to a problem.  Also, over-simplification of spatial patterns can lead to a similar fate.  The more realistic the maps are, the better chance there is of accuracy.  The larger the sample size, the better chance there is of precision.  If there is enough mental capacity and usage of software combined, we can accomplish both of these goals and be both accurate and precise in our predictions. 

Wednesday, February 6, 2013

Not Being Put to Full Use


GIS technology is widely used in public planning departments of local governments, but often not their full potential. Studies in Wisconsin have shown that the majority of agencies only use GIS for basic map making and data set management. By using software for site analysis, visualization, land suitability analysis and impact assessment, planning offices could improve the ability of the planners to serve their community. The primary obstacles to fully utilizing GIS technology was the lack of training and workshops, as well as funding problems relating to continued training. This is congruent with studies from a decade ago, which hypothesized that education and training issues would overtake initial fear of change and new technology as GIS become increasingly commonplace. The creation of seminars and workshops to inform planners of advanced applications of GIS technology as well as continuing education will significantly increase use. Unfortunately, as planning related GIS trainning is limited, the distance workers may have to travel could hamper the success of workshops.


Works Cited
Gocmen, Z. Aslıgul, and Stephen J. Ventura. "Barriers To GIS Use In Planning." Journal Of The American Planning Association 76.2 (2010): 172-183. Academic Search Complete. Web. 22 Mar. 2013.

Tuesday, February 5, 2013

Disease Mapping for Public Health Purposes

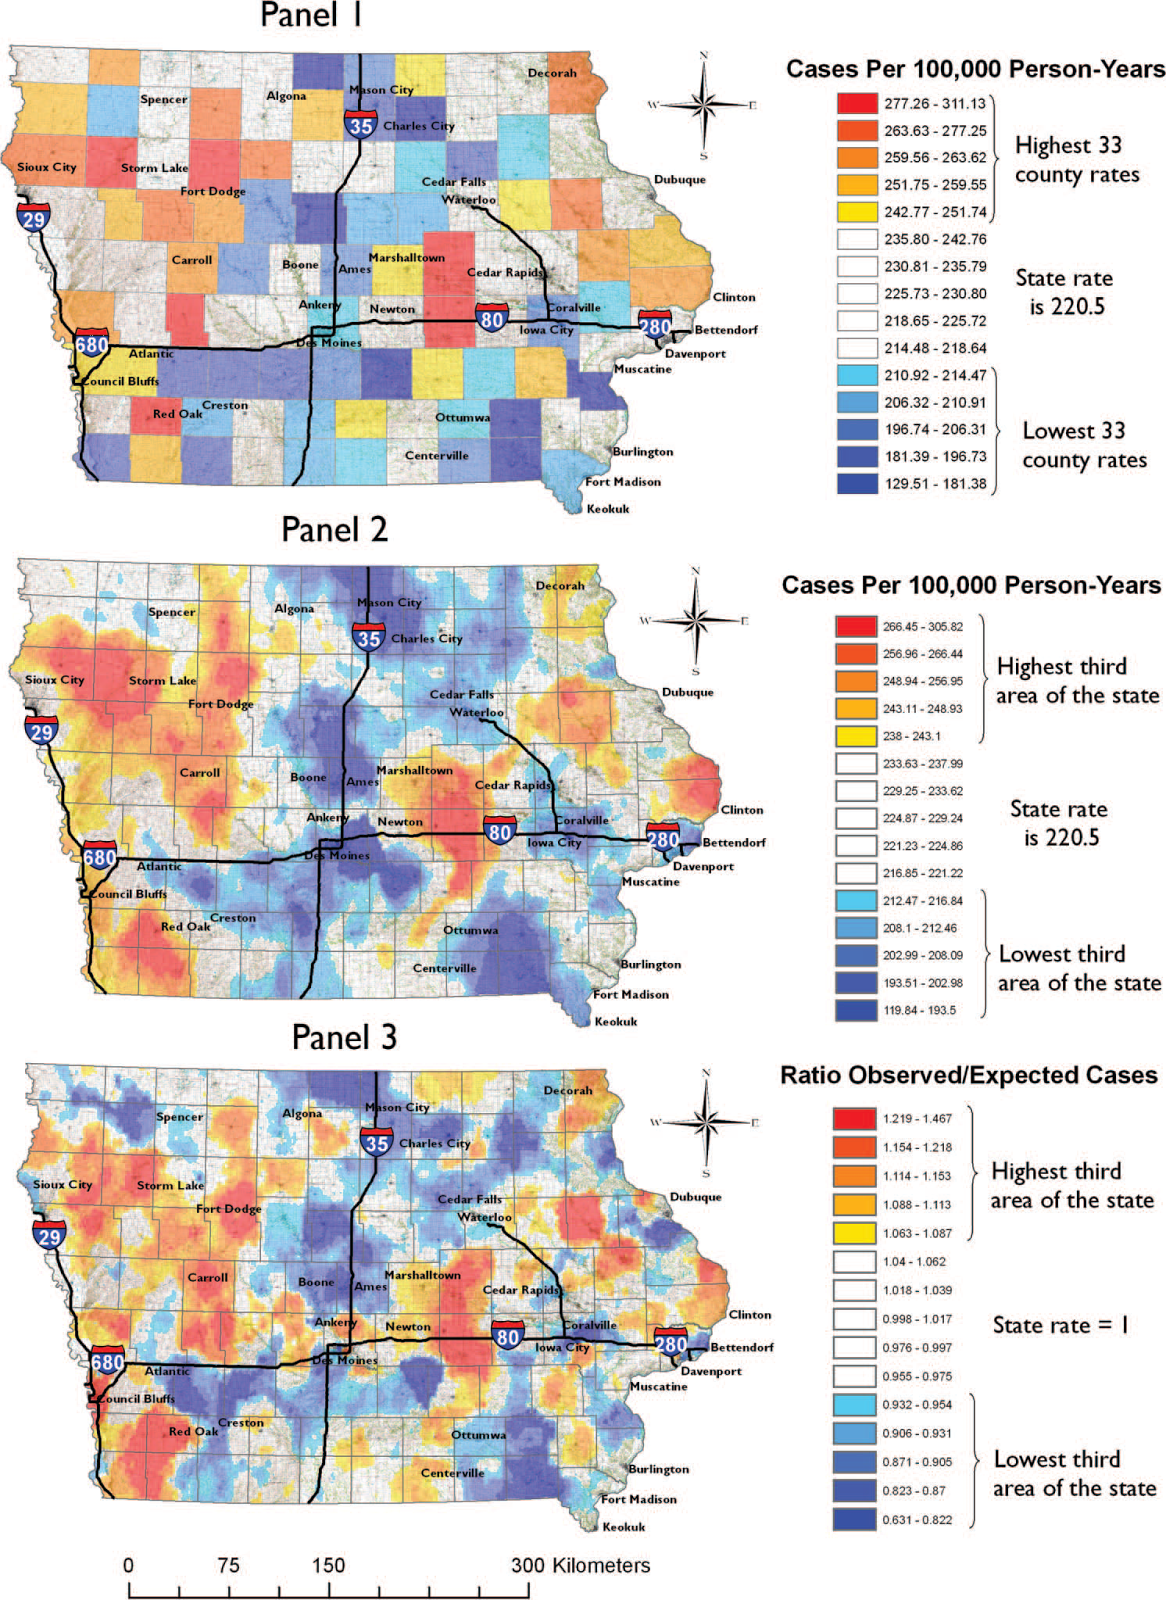
The spread of disease is an issue that many governments and organizations want to prevent. Outbreaks of the flu and other diseases occur all the time and need to be monitored closely. Disease maps can provide a visual tool for plotting the spread of illness; which can allow for the transportation of relief to areas most effected and vaccines to surrounding areas before they are effected.

Beyer, Tiwari, and Rushton developed a five point methodology for creating disease maps:
  1. Control the population basis of spatial support for estimating disease outbreak rates (Rates of smaller populations aren't as reliable as larger populations because they have a smaller sample size and have more variability).
  2.  Display rates continuously through space (Choosing the best unit of area for the map is essential because it can change the observed spatial pattern of the disease).
  3. Provide maximum geographic detail across the map (Mapping a rate by a predetermined unit inherently prevents the exploration of the spatial variability within that rate).
  4. consider directly and indirectly age/sex-adjusted rates (People of Younger or older age may have higher rates than those in their prime, and certain diseases can only be contracted by a certain sex).
  5. visualize rates within a relevant place context (Larger areas carry more visual weight than smaller ones even though larger areas can be characterized by a low population density and are more likely to have more variable rates).


 Beyer, Tiwari, and Rushton realize however that this way of mapping diseases is, in and of itself, imperfect, and that future disease mapping could include statistical confidence to improve the quality of the presented information. Because of the difference in population density future disease mapping can address the potential problem of including information from distant locations or different settings (Urban and Rural).

Beyer, K. M., Tiwari, C., & Rushton, G. (2012). Five Essential Properties of Disease Maps. Annals Of The Association Of American Geographers, 102(5), 1067-1075. doi:10.1080/00045608.2012.659940

Monday, February 4, 2013

Neighborhoods and Health


Neighborhoods and Health – The Importance of Place

A New Zealand study was done that measured neighborhoods’ distance to various health based venues such as: parks, fresh food establishments, gyms, and hospitals. Implementing GIS methods into this type of research allowed for greater access to and understanding of health related effects at a community level. The new index that was created will allow for researchers to determine the impact of various neighborhoods on resident’s health.  

Under this new index, New Zealand was divided into quintiles of accessibility. Unsurprisingly, there were great variations in access between rural and urban neighborhoods. Overall, the most accessible community resource was parks, and the least accessible was beaches. The following map shows each community's distance to fresh food.


The findings of this study suggest that increased residential proximity to healthcare and recreational facilities lowers the opportunity costs of attending, thus increasing the general health level of surrounding communities. This creates many implications for future policy makers when choosing areas to target for service and amenity planning. This information could also lead to a shift in housing prices as the "healthier" communities experience an increase in residents